I'm trying to find a better debugging experience for my current projects (zig/c, nixos).
Usually I just use vanilla gdb. Here is a debugging session I ran recently on this linux x64 binary.
1. Open and run until crash.
[nix-shell:~/focus]$ gdb ./test
...
(gdb) run
...
Test [1/1] test "search forwards"... reached unreachable code
/nix/store/5g4w66g606d46w8pmzwzq7flrlk3k7cs-zig/lib/zig/std/debug.zig:223:14: 0x204018 in std.debug.assert (test)
    if (!ok) unreachable; // assertion failure
             ^
/home/jamie/focus/lib/focus/tree.zig:822:11: 0x205d44 in test "search forwards" (test)
    assert(meta.deepEqual(expected.items, actual.items));
          ^
/nix/store/5g4w66g606d46w8pmzwzq7flrlk3k7cs-zig/lib/zig/std/special/test_runner.zig:61:28: 0x207bc8 in std.special.main (test)
        } else test_fn.func();
                           ^
/nix/store/5g4w66g606d46w8pmzwzq7flrlk3k7cs-zig/lib/zig/std/start.zig:334:37: 0x209961 in std.start.main (test)
            const result = root.main() catch |err| {
                                    ^

Program received signal SIGABRT, Aborted.
0x00007ffff7e4608a in raise ()
   from /nix/store/9df65igwjmf2wbw0gbrrgair6piqjgmi-glibc-2.31/lib/libc.so.6
2. Find out where expected and actual differ.
(gdb) up
#1  0x00007ffff7e30528 in abort ()
   from /nix/store/9df65igwjmf2wbw0gbrrgair6piqjgmi-glibc-2.31/lib/libc.so.6
(gdb)
#2  0x0000000000209d09 in std.os.abort ()
    at /nix/store/5g4w66g606d46w8pmzwzq7flrlk3k7cs-zig/lib/zig/std/os.zig:228
228	    system.abort();
(gdb)
#3  0x0000000000206126 in std.debug.panicExtra (
    trace=0x0, first_trace_addr=..., args=...)
    at /nix/store/5g4w66g606d46w8pmzwzq7flrlk3k7cs-zig/lib/zig/std/debug.zig:297
297	    os.abort();
(gdb)
#4  0x0000000000203feb in std.builtin.default_panic (
    msg=..., error_return_trace=0x0)
    at /nix/store/5g4w66g606d46w8pmzwzq7flrlk3k7cs-zig/lib/zig/std/builtin.zig:614
614	            std.debug.panicExtra(error_return_trace, first_trace_addr, "{}", .{msg});
(gdb)
#5  0x0000000000204019 in std.debug.assert (ok=false)
    at /nix/store/5g4w66g606d46w8pmzwzq7flrlk3k7cs-zig/lib/zig/std/debug.zig:223
223	    if (!ok) unreachable; // assertion failure
(gdb)
#6  0x0000000000205d45 in test "search forwards" ()
    at /home/jamie/focus/lib/focus/tree.zig:822
822	    assert(meta.deepEqual(expected.items, actual.items));
(gdb) p *actual.items.ptr@actual.items.len
value requires 10535192 bytes, which is more than max-value-size
(gdb) p *actual.items.ptr@100
$1 = {6, 23, 58, 116, 150, 182, 216, 238, 258, 316,
  342, 380, 486, 756, 765, 924, 1076, 1098, 1342, 1391,
  1440, 1506, 1520, 1545, 1670, 1908, 1912, 1947, 2034,
  2049, 2056, 2094, 2192, 2219, 2256, 2279, 2281, 2302,
  2326, 2337, 2343, 2357, 2395, 2406, 2415, 2439, 2477,
  2545, 2558, 2627, 2726, 2741, 2784, 2884, 2918, 2957,
  2964, 2979, 3005, 3036, 3073, 3184, 3200, 3250, 3361,
  3368, 3394, 3443, 3450, 3570, 3610, 3622, 3695, 3698,
  3723, 3759, 3794, 3839, 3845, 3862, 3879, 3945, 3973,
  3981, 4016, 4048, 4057, 4085, 4109, 4117, 4141, 4187,
  4195, 4230, 4281, 4312, 4320, 4483, 4520, 4551}
(gdb) p *expected.items.ptr@100
$2 = {2234, 2383, 2750, 2819, 2834, 2846, 3209, 3259,
  4906, 4963, 69523, 69618, 69741, 69804, 76615, 76649,
  83714, 84688, 85167, 85349, 85455, 85618, 86943,
  87503, 88050, 118034, 176105, 176270, 176364, 176784,
  176800, 176917, 176989, 242254, 294377, 310605,
  311421, 311452, 319422, 371180, 379116, 385711,
  397560, 397709, 398076, 398145, 398160, 398172,
  398535, 398585, 400228, 400285, 464845, 464940,
  465063, 465126, 471937, 471971, 479036, 480010,
  480489, 480671, 480777, 480940, 482265, 482825,
  483372, 513356, 571427, 571592, 571686, 572106,
  572122, 572239, 572311, 637576, 689699, 705927,
  706743, 706774, 714744, 766502, 774438, 781033,
  792882, 793031, 793398, 793467, 793482, 793494,
  793857, 793907, 795550, 795607, 860167, 860262,
  860385, 860448, 867259, 867293}
3. Put a breakpoint on the loop in Tree.searchForwards and run again.
(gdb) b tree.zig:596
Breakpoint 1 at 0x2072d0: file /home/jamie/focus/lib/focus/tree.zig, line 596.
(gdb) run
The program being debugged has been started already.
Start it from the beginning? (y or n) y
Starting program: /home/jamie/focus/test
[Thread debugging using libthread_db enabled]
Using host libthread_db library "/nix/store/9df65igwjmf2wbw0gbrrgair6piqjgmi-glibc-2.31/lib/libthread_db.so.1".
Test [1/1] test "search forwards"...
Breakpoint 1, Tree.searchForwards (self=..., start=0,
    needle=...)
    at /home/jamie/focus/lib/focus/tree.zig:596
596	            const haystack_start_char = start_point.getNextByte();
4. Step through, looking at loop variables each iteration.
(gdb) n
597	            if (haystack_start_char == needle_start_char) {
(gdb)
609	            if (start_point.seekNextByte() == .NotFound) return null;
(gdb)
595	        while (true) {
(gdb)

Breakpoint 1, Tree.searchForwards (self=..., start=0,
    needle=...)
    at /home/jamie/focus/lib/focus/tree.zig:596
596	            const haystack_start_char = start_point.getNextByte();
(gdb)
597	            if (haystack_start_char == needle_start_char) {
(gdb)
598	                var end_point = start_point;
(gdb) p start_point
$4 = {pos = 6, leaf = {node = 0x7ffff76e7000,
    bytes = 0x7ffff76e7009,
    static max_bytes = <optimized out>,
    static bytes_offset = <optimized out>},
  num_leaf_bytes = 2043, offset = 6}
(gdb) n
599	                var is_match = true;
(gdb)
600	                for (needle[1..]) |needle_char| {
(gdb)
601	                    if (end_point.seekNextByte() == .Found)
(gdb)
602	                        if (end_point.getNextByte() != needle_char)
(gdb)
600	                for (needle[1..]) |needle_char| {
(gdb) p needle_char
$5 = 108 'l'
(gdb) end_point.pos
Undefined command: "end_point.pos".  Try "help".
(gdb) p end_point.pos
$9 = 7
(gdb) p *point.leaf.bytes@end_point.pos
No symbol "point" in current context.
(gdb) p *end_point.leaf.bytes@end_point.pos
$10 = {
  "\n\n(function (global, factory) {\n  typeof exports === 'object' && typeof module !== 'undefined' ? module.exports = factory() :\n  typeof define === 'function' && define.amd ? define(factory) :\n  (global"...,
  "\000@f\367\377\177\000\000\000(gutterWrap);\n      wrap$1.insertBefore(gutterWrap, lineView.text);\n      if (lineView.line.gutterClass)\n        { gutterWrap.className += \" \" + lineView.line.gutterClass; }\n      if (cm.opti"...,
  "play.meas\000`n\367\377\177\000\000\000ghtClick = gecko || (ie && ie_version >= 9);\n\n  function classTest(cls) { return new RegExp(\"(^|\\\\s)\" + cls + \"(?:$|\\\\s)\\\\s*\") }\n\n  var rmClass = function(node, cls) {\n    var curren"...,
  "tartIndex, startVa\000`n\367\377\177\000\000\000hild.nodeType == 11) { child = child.host; }\n      if (child == parent) { return true }\n    } while (child = child.parentNode)\n  }\n\n  function activeElt() {\n    // IE and Ed"...,
  "ction insertSorted(array, v\000`n\367\377\177\000\000\000alue) {\n    if (end == null) {\n      end = string.search(/[^\\s\\u00a0]/);\n      if (end == -1) { end = string.length; }\n    }\n    for (var i = startIndex || 0, n = s"...,
  "bbe\\u0bc0\\u0bcd\\u0bd7\\u0c3e-\\u0c40\\u\000`n\367\377\177\000\000\000value, score) {\n    var pos = 0, priority = score(value);\n    while (pos < array.length && score(array[pos]) <= priority) { pos++; }\n    array.splice(pos, "...,
  "   var dir = from > to ? -1 : 1;\n    for (;;)\000`n\367\377\177\000\000\000u0c46-\\u0c48\\u0c4a-\\u0c4d\\u0c55\\u0c56\\u0c62\\u0c63\\u0cbc\\u0cbf\\u0cc2\\u0cc6\\u0ccc\\u0ccd\\u0cd5\\u0cd6\\u0ce2\\u0ce3\\u0d3e\\u0d41-\\u0d44\\u0d4d\\u0d57\\u0d62"...}
(gdb) p *end_point.leaf.bytes
$11 = "\n\n(function (global, factory) {\n  typeof exports === 'object' && typeof module !== 'undefined' ? module.exports = factory() :\n  typeof define === 'function' && define.amd ? define(factory) :\n  (global"...
(gdb) p *end_point.leaf.bytes[end_point.pos]
$12 = 121 'y'
(gdb) p (*end_point.leaf.bytes)[end_point.pos]
$14 = 116 't'
The console interface to gdb works, but it's inefficient:
- I can't easily see the surrounding code
- I have to manually request information rather than just glancing at the display
- I have to remember syntax rather than just clicking on things
- ...and in this case, it took me a few tries to correctly deref this pointer to an fixed-size array
The command-oriented interface is sometimes really useful, but it would a lot more efficient to have basic information like local variables displayed by default and to be able to point and click for basic actions. So I went looking for a gui frontend.
All examples below were run on nixos 20.09 with sway which, to be fair, is playing on hard mode.
gdb -tui
jamie@machine:~$ gdb --version
GNU gdb (GDB) 9.2
gdb has a built-in curses gui. It solves problem 1 by displaying the surrounding code in the top half of the window.
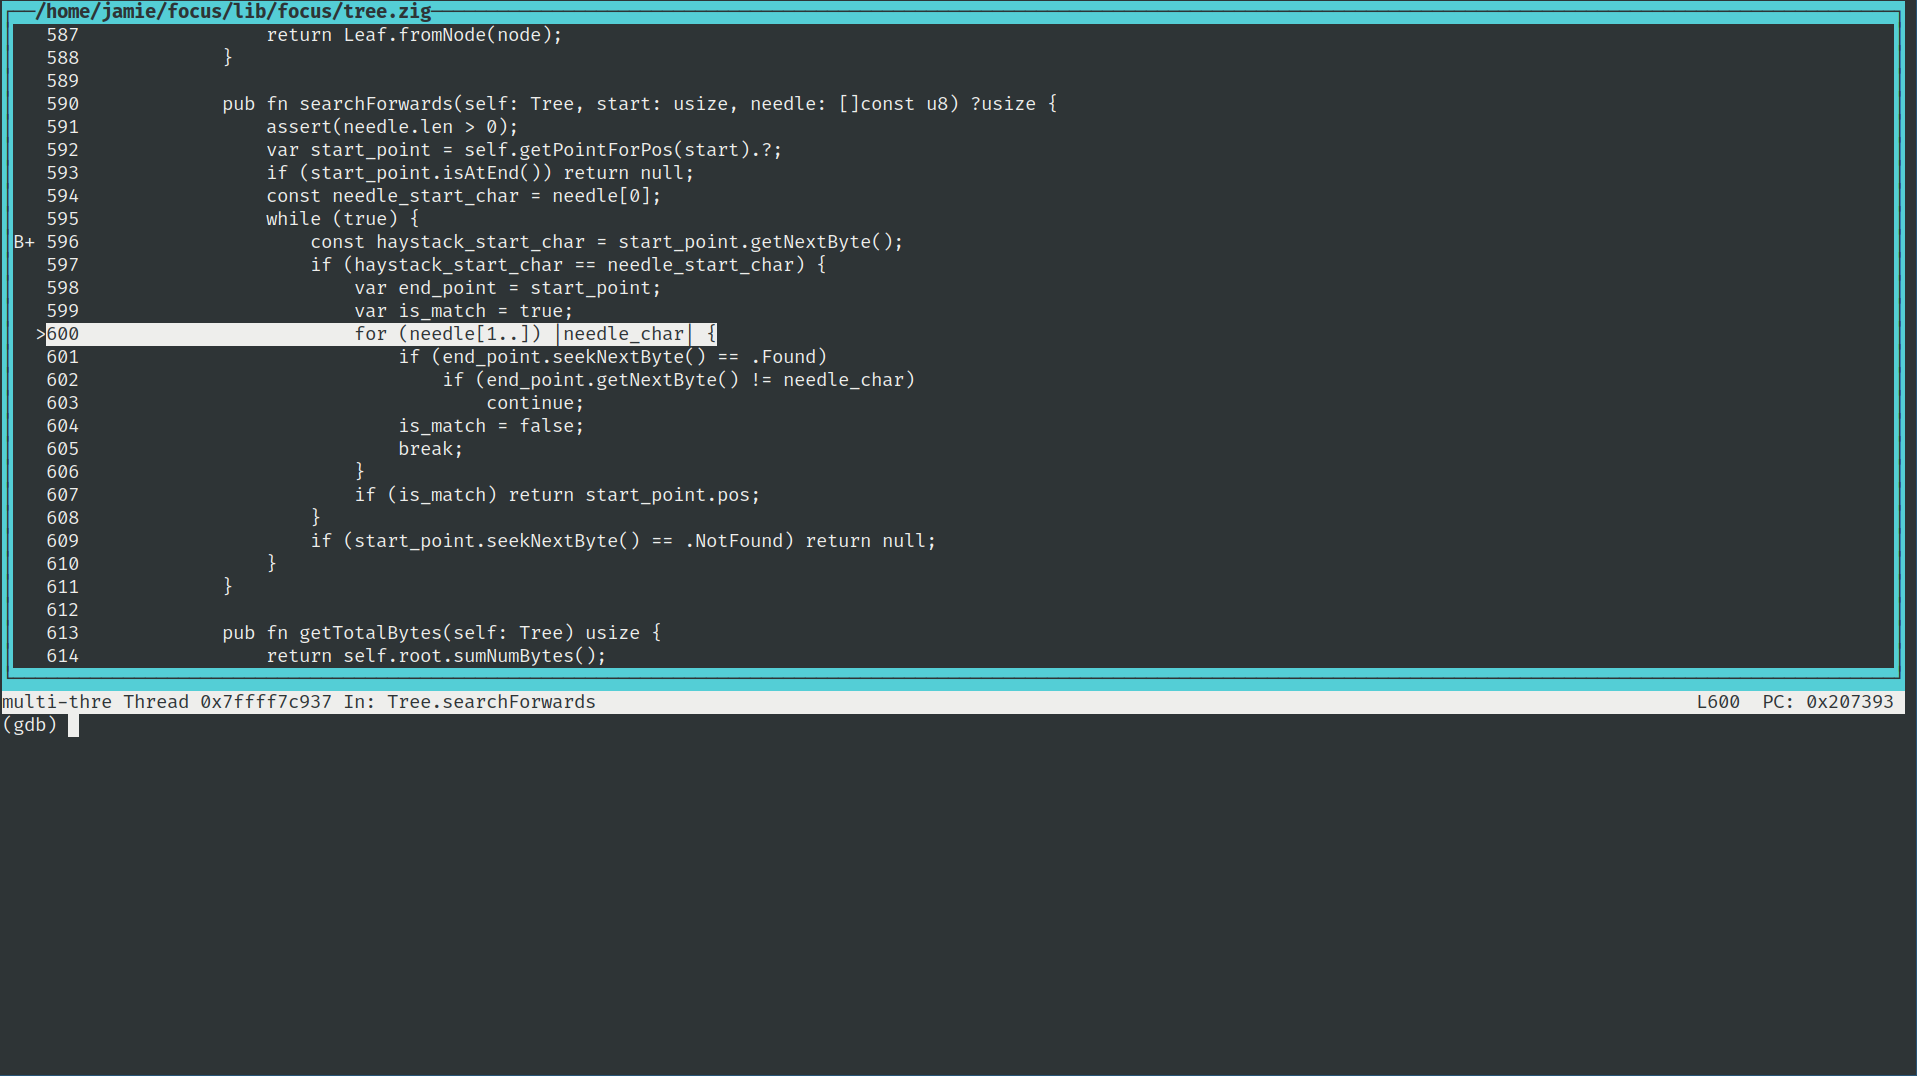
Unfortunately, it's pretty buggy:
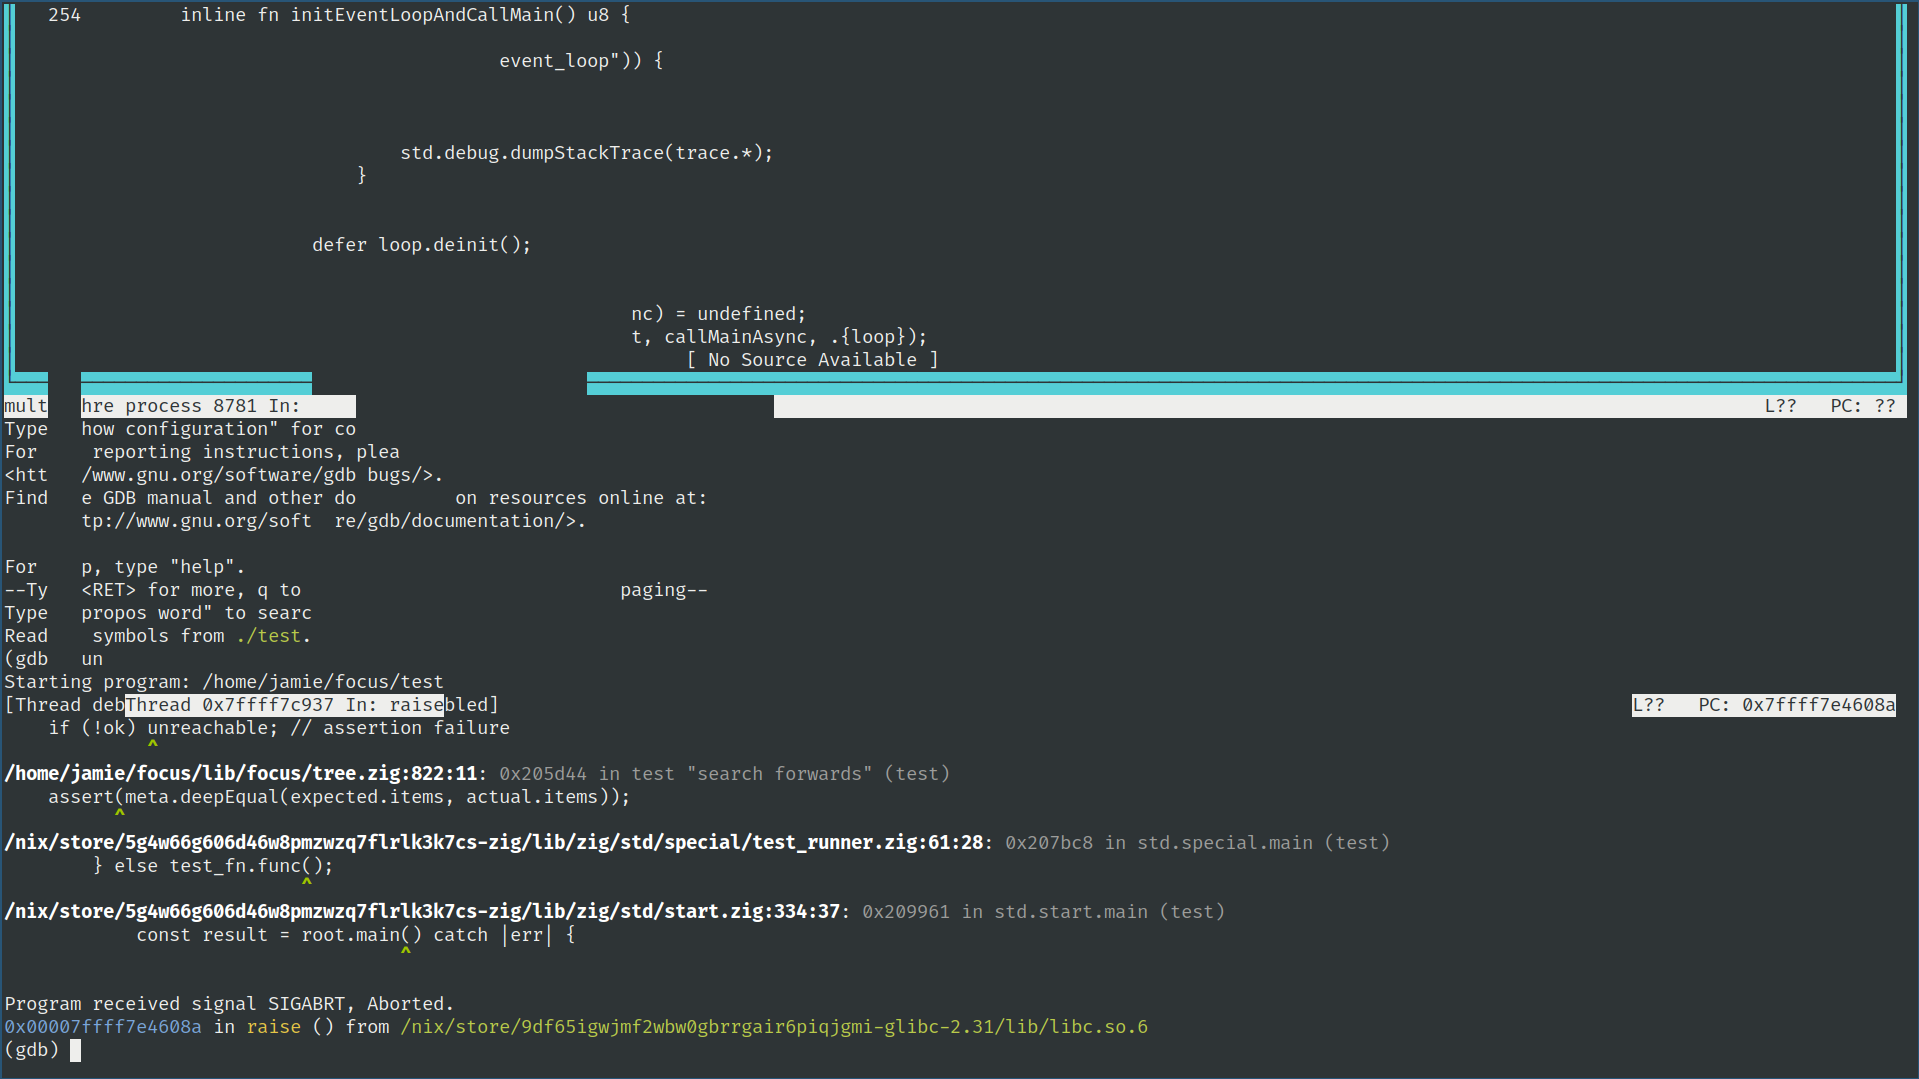
It also takes over the arrow keys, which makes it much harder to edit and run commands in the bottom half of the window.
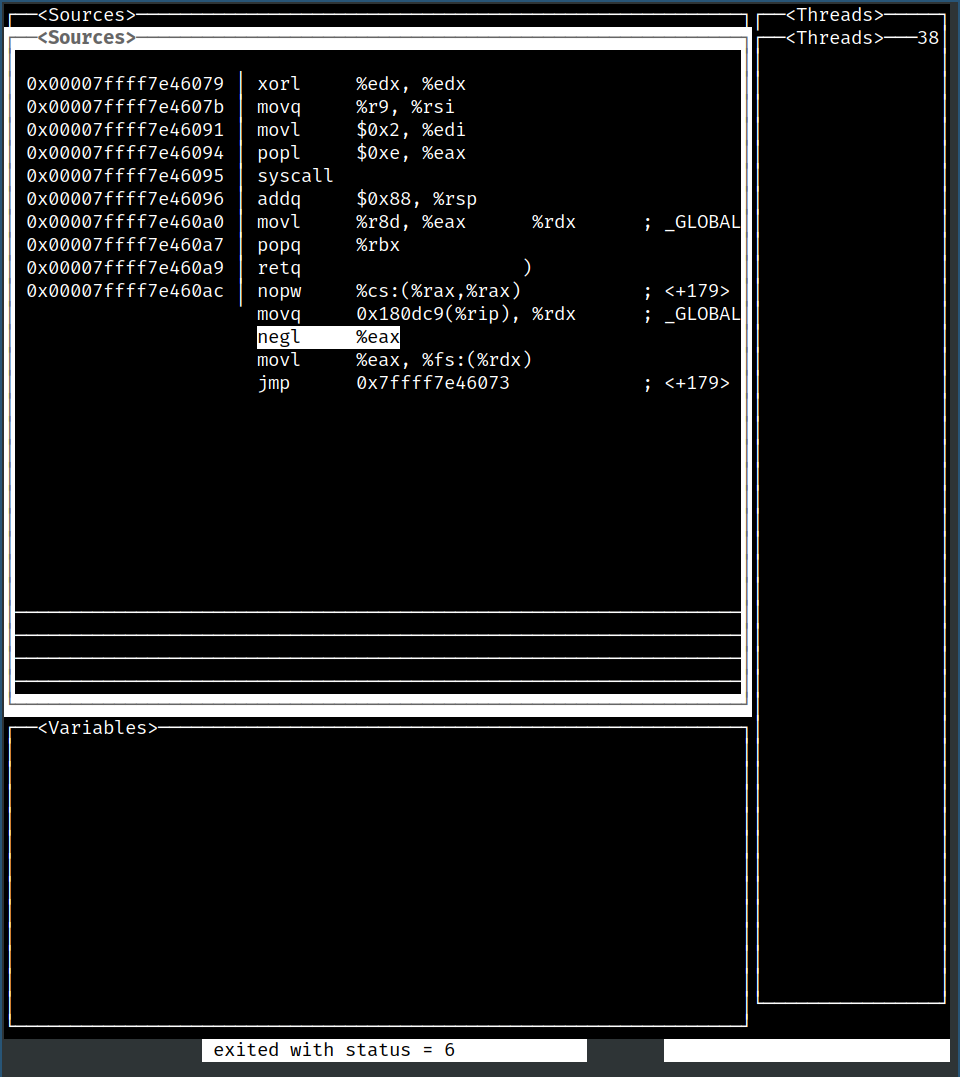
It might be nice to toggle back and forth, but the command tui disable crashes gdb.
[nix-shell:~]$ gdb -tui
Aborted (core dumped)
lldb gui
jamie@machine:~$ lldb --version
lldb version 7.1.0
lldb also has a built-in curses gui, accessed by the gui command.
I wasn't able to persuade it to so much as display a backtrace, but I could pretty consistently produce weird rendering bugs.
emacs gud
jamie@machine:~$ emacs --version
GNU Emacs 27.1
A very thin layer over gdb. Unlike gdb -tui, the console window is still usable while the code window is open. I can set breakpoints or print the expression under the cursor.
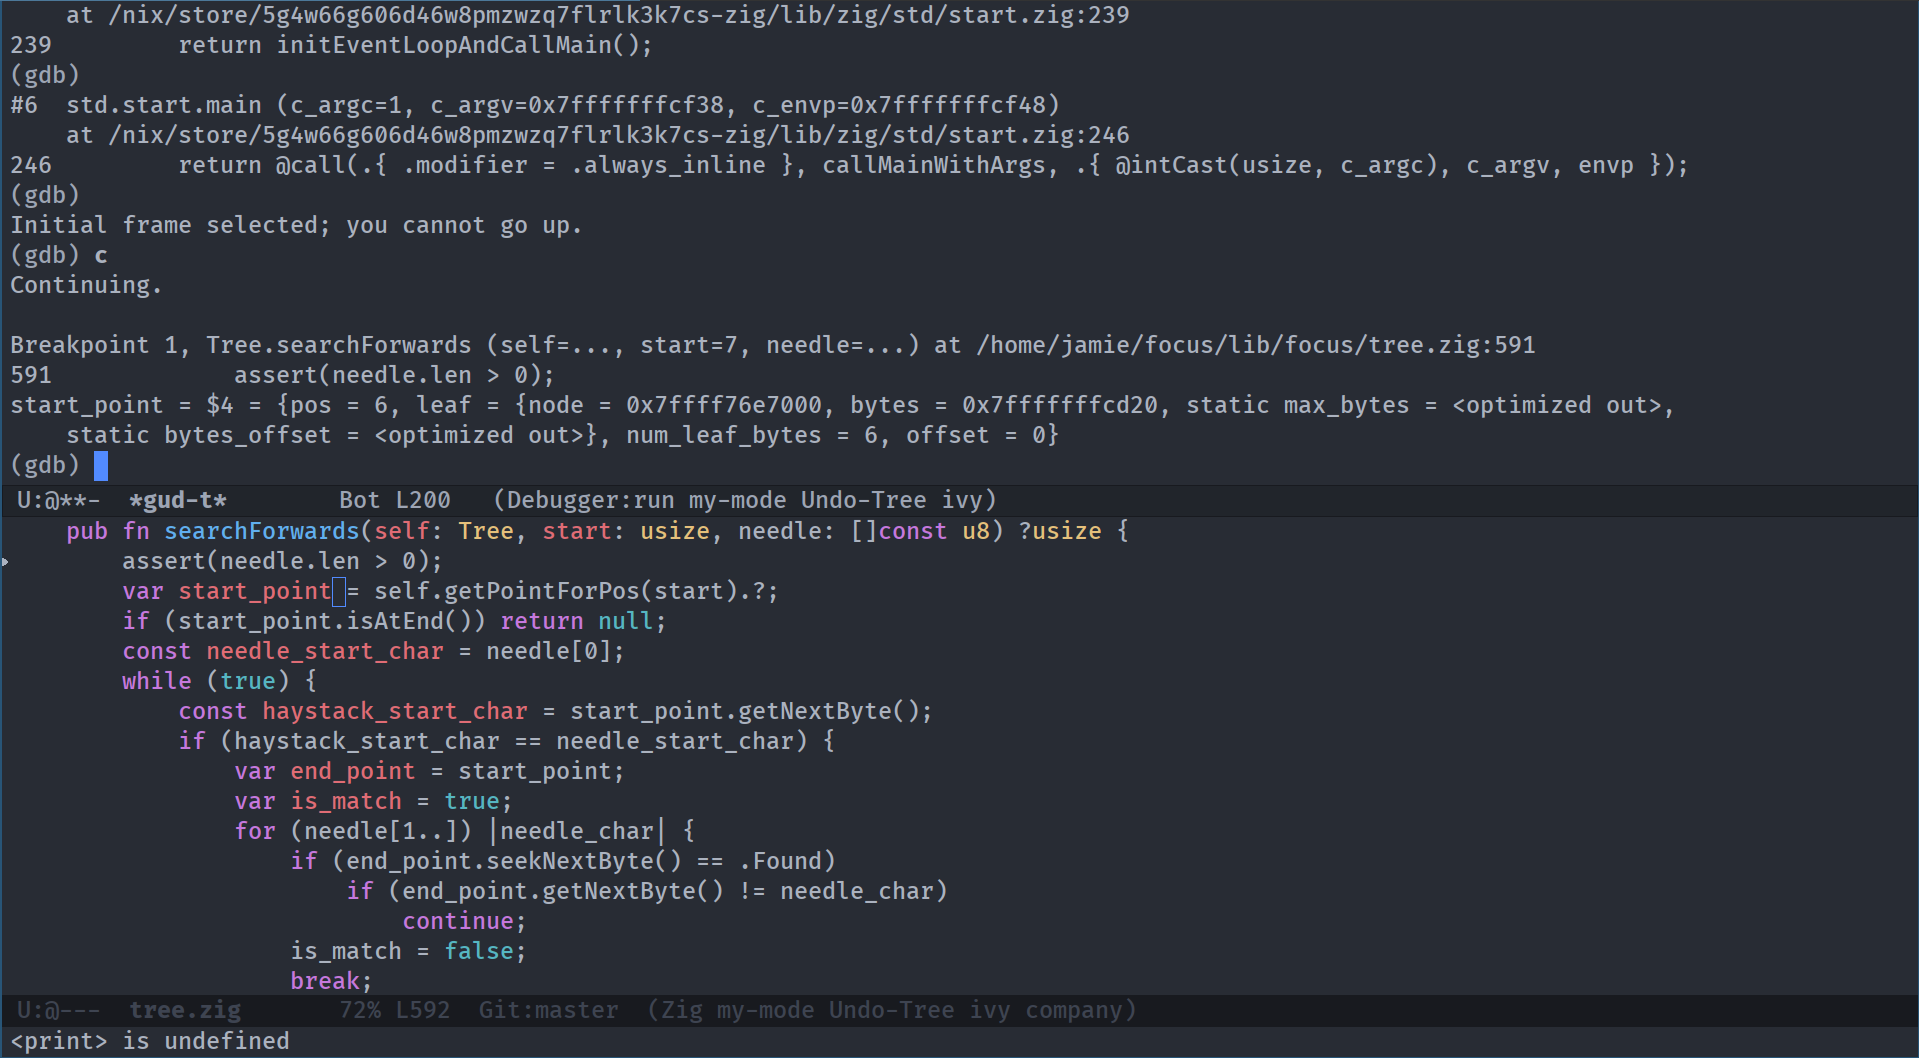
I haven't found a way to display the backtrace, list local variables or view memory.
kdbg
[nix-shell:~/focus]$ kdbg --version
QCommandLineParser: already having an option named "h"
QCommandLineParser: already having an option named "help-all"
QCommandLineParser: already having an option named "v"
kdbg 3.0.1
The gui doesn't seem to have a way to open an executable.
Using "Open Source Code" produces a file dialog that doesn't seem to have a way to paste paths. It can open the zig source file, but that still doesn't lead to a way to run anything.
Passing the test exe at the command line (kdbg /writing/looking-for-debugger/test) open up an editor at start.S but still doesn't seem to have a way to run the exe.
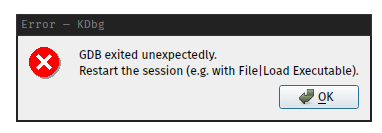
After a while it produces an error message prompting me to use a menu entry that doesn't exist:
gdbgui
[nix-shell:~]$ gdbgui --version
0.13.2.1
Opens the UI in a browser tab.
The interface is unusably slow in firefox, but passable in chrome.
I was able to run the test program. It stopped automatically at the entry to main. Clicking the continue button lead to no noticable change in the UI, but after ~20s produced:
gdbgui noticed a signal was received (Aborted, SIGABRT).
If the program exited due to a fault, you can attempt to re-enter the state of the program when the fault
occurred by clicking the below button.
The first time I clicked said button it produced:
The program no longer exists.
backtrace
No stack.
No stack.
I restarted and went through the same process and this time got a backtrace.
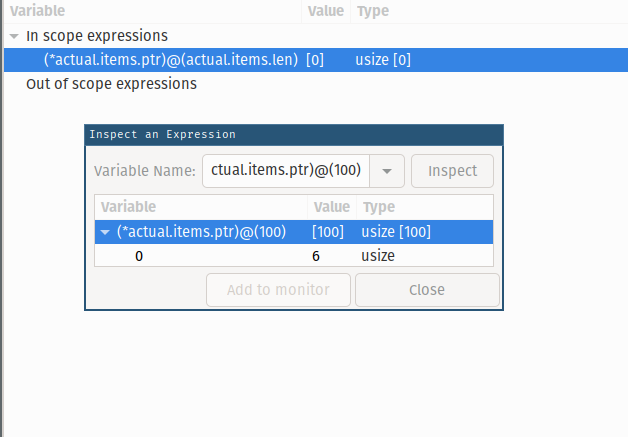
I wasn't able to figure out how to look at the contents of actual/expected in the inspector. Adding an expression manually also didn't work at first.
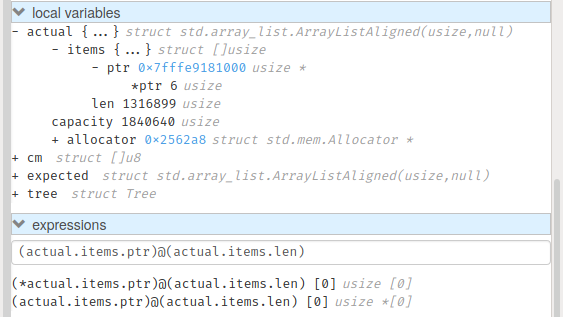
It seems that gdbgui silently swallowed this error from gdb:
p (*actual.items.ptr)@(actual.items.len)
value requires 10535192 bytes, which is more than max-value-size
Giving 100 as the length worked and was good enough for this test.
While I was scrolling through the code to set a breakpoint, it blanked out the pane for a few seconds before reloading at a different position.
Clicking in the margin sets a breakpoint, as expected.
Stepping though the code with 'n' took >2s per press, which is unbearably slow when stepping through a lot of code. In gdb itself this is instant.
Expanding start_point.leaf.bytes caused the UI to hang long enough for chrome to pop up the 'kill or wait' dialog. It finished after >30s.
I tried looking at the leaf in the memory browser too. It seems functional, if a little slow. The 'more' button used for scrolling could also be better - it's not clear how many lines it's going to scroll and it blanks the pane for a few seconds which is disorienting.
[nix-shell:~]$ time gdbgui --version
0.13.2.1

real	0m1.477s
user	0m1.358s
sys	0m0.120s
gede
[nix-shell:~]$ gede --version
gede 2.16.2
The gui is snappy and I got started easily.
There was no way to read expected/actual directly in the inspector. A right click took me to the memory view but there doesn't seem to be a way to view it as 64 bit words instead of byte-by-byte.
The memory view also seems buggy - scrolling downwards works fine but scrolling upwards makes the text scroll off the screen (EDIT as of gede 2.17.1 I can no longer repro this):
Like gdbgui, gede also swallows the error from too-large expression values, which makes me wonder whether it's the gdp api that is doing that (EDIT confirmed by the gede author). Unlike gdbgui, rendering the 100 element array was instant.
At this point, gede popped up a window that just said "unreachable=" but everything still seemed to work so I just closed it.
Hitting F6 for next seems snappy and even animated pretty fast when I held it down:
It doesn't seem to be possible to give commands directly to gdb from gede, but gede can connect to a running gdb session. I haven't tested that yet.
Gede can also attach to a process, chosen from a nice dropdown list, but it doesn't seem to able to locate symbols when it does this even though gdb itself can (EDIT as of gede 2.17.1 it can load symbols if I explicitly specify the executable used, which is an improvement but still error-prone).
nemiver
Getting started was easy enough. I found the layout of the various windows confusing though - I can't look at the stack and my watches at the same time?
Like the others, nemiver swallows the error for the too-large variable value. For some reason I wasn't able to add the expression that actually works - the add button got grayed out.
I wasn't able to set a breakpoint by clicking on a line. The 'Debug' menu had two entries labeled 'Set Breakpoint' with different keyboard shortcuts. Only one of them worked directly. The other opened a dialog, seemingly the exact same dialog as 'Set Breakpoint With Dialog'.
Holding down 'F6' for next seemed much slower than gede. Maybe it's running at the keyboard repeat rate, because individual presses seem very snappy.
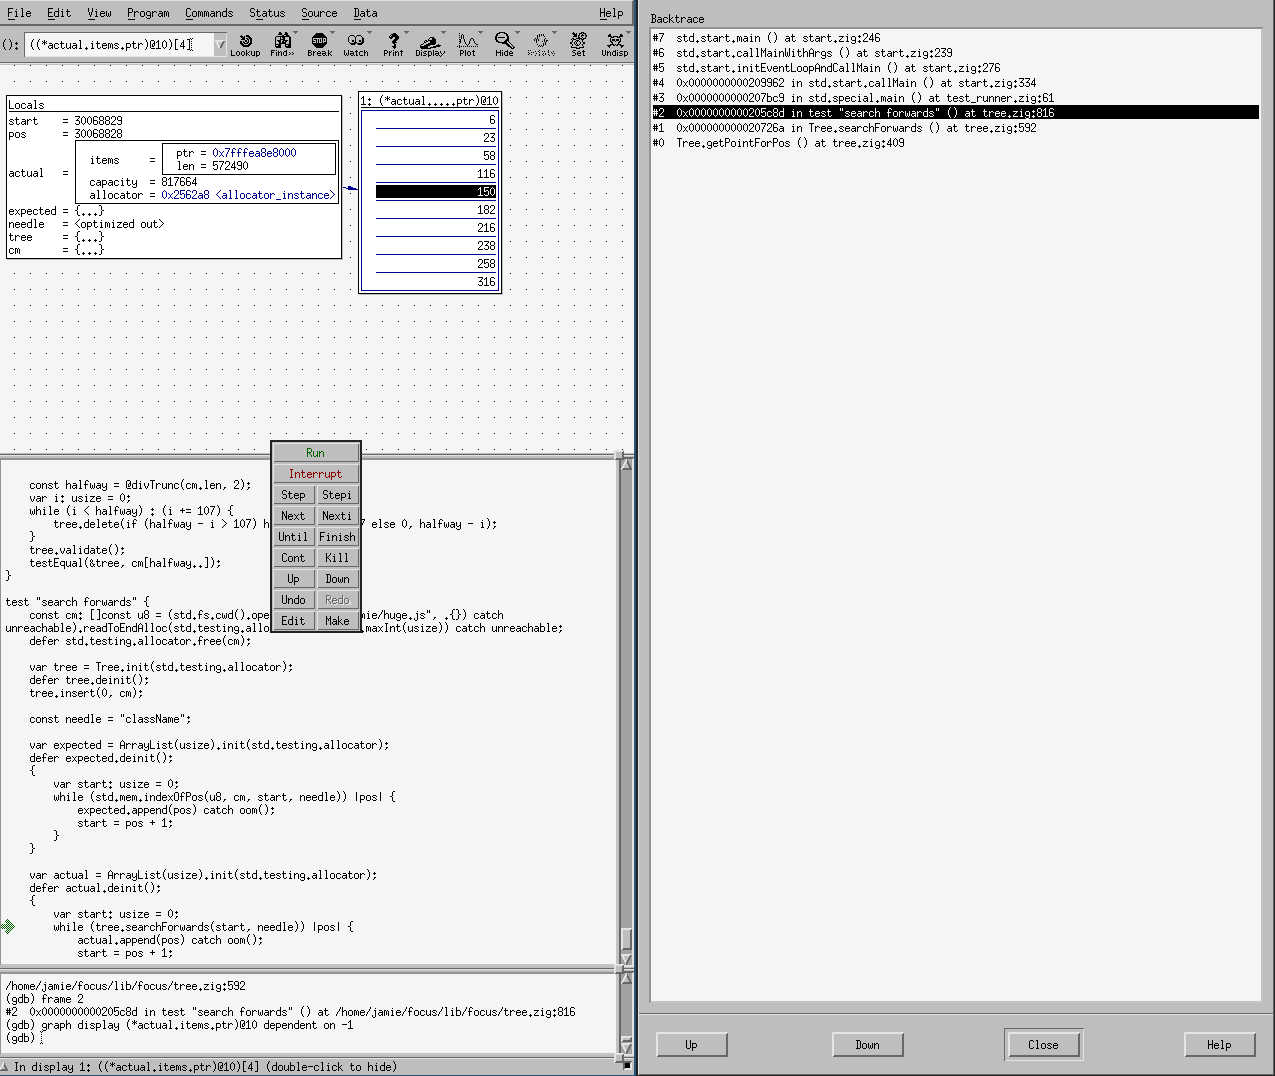
ddd
[nix-shell:~/focus]$ ddd --version
GNU DDD 3.3.12 (x86_64-unknown-linux-gnu)
The UI is pretty quirky and it took me a while to figure out basic things like how to display a backtrace.
The keyboard shortcuts in the menus don't seem to work eg pressing F6 does not step the program.
The text boxes for eg the memory window don't seem to support copy/paste and also didn't consistently accept keypresses at all. I had to open and close the memory view a few times before I could type numbers in it.
The builtin plotter seemed like a neat idea but it got stuck on "Starting gnuplot...". Similarly, the "execution window" got stuck on "Starting xterm...". Hitting cancel in the latter had no effect, and in the former produced:
Segmentation fault

Internal error (Segmentation fault).

Oops!  You have found a bug in DDD.

If you can reproduce this bug, please send a bug report
to <ddd@gnu.org>, giving a subject like

    DDD 3.3.12 (x86_64-unknown-linux-gnu) gets `Segmentation fault' signal

To enable us to fix the bug, you should include the following information:
* What you were doing to get this message.  Report all the facts.
* The contents of the `~/.ddd/log' file as generated by this session.
Please read also the section "Reporting Bugs" in the DDD manual.

We thank you for your support.

Segmentation fault (core dumped)
eclipse
jamie@machine:~$ lldb --version
lldb version 7.1.0
Eclipse does not play well with my window manager.
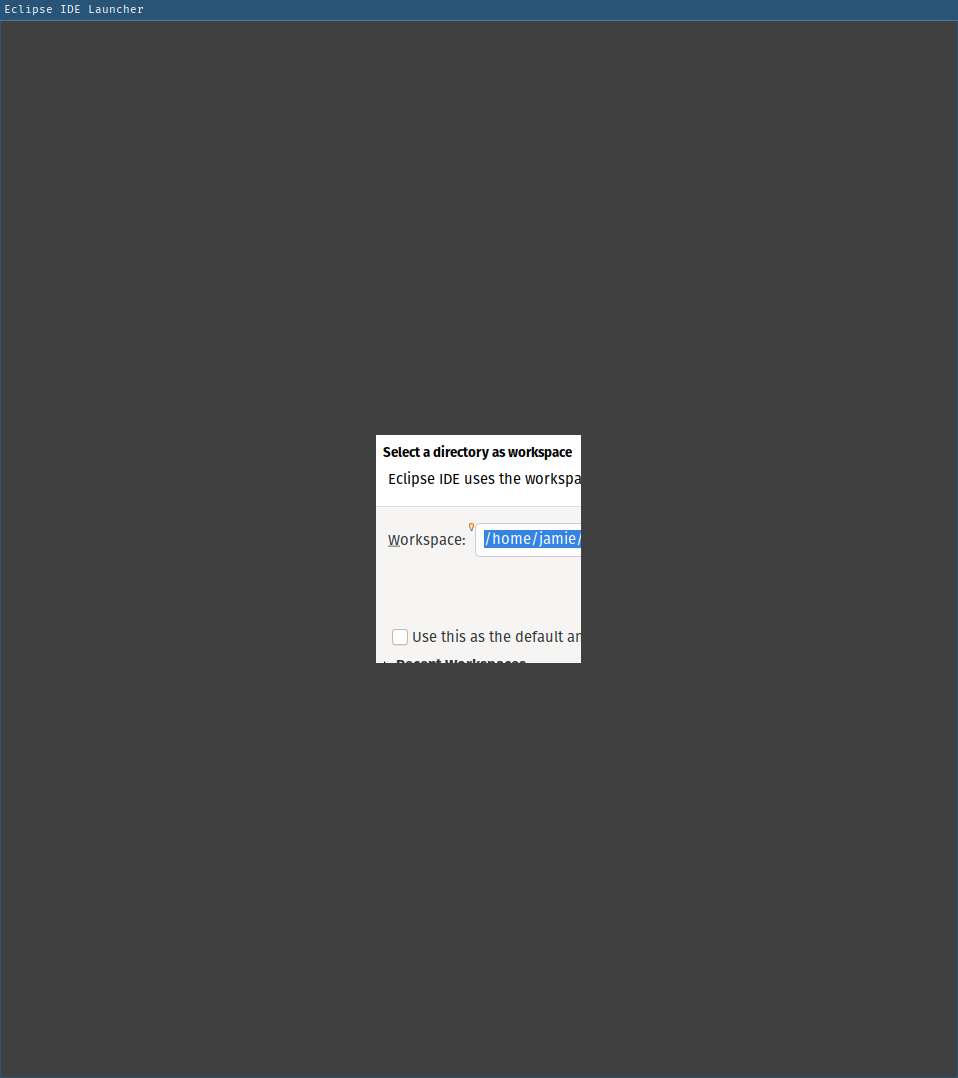
While eclipse prefers to own everything, it can be persuaded to debug an existing binary with enough clicking around in the 'Run -> Debug Configurations'.
Running the executable went smoothly.
It seems to have a hard time displaying values:
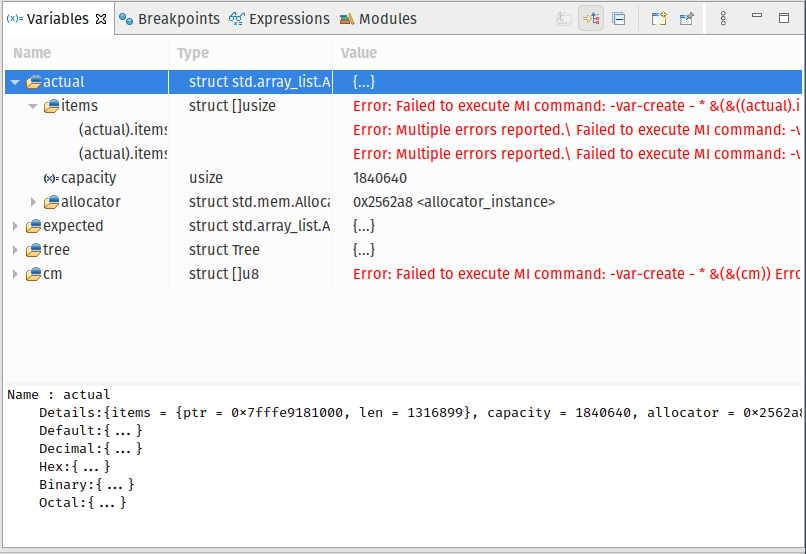
Also the buttons to set breakpoints were all greyed out. Maybe only enabled in C/C++ files?
Unlike gede, it does allow direct access to the gdb console so I was able to set a breakpoint manually.
Stepping through with F6 animates quickly, like gede.
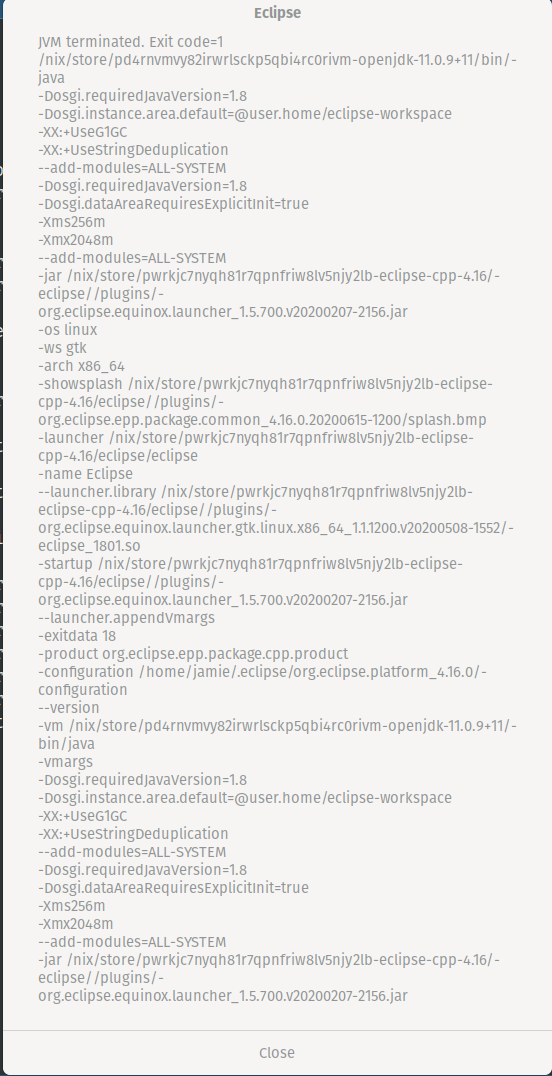
Unfortunately when I tried to copy the version info from the about window into this post, eclipse crashed.
jetbrains clion
Version 2020.2.1
Like eclipse, clion took some bullying before reluctantly debugging a binary it didn't build itself.
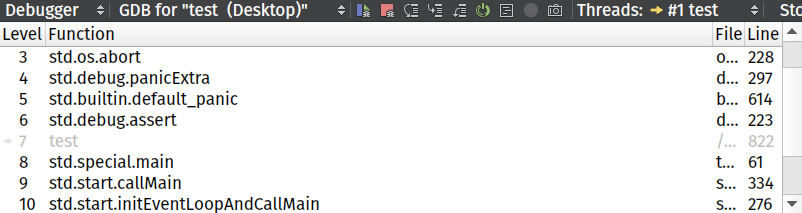
After breaking on the failing assert, I can step up and down the stack but I'm not able to view any variables.
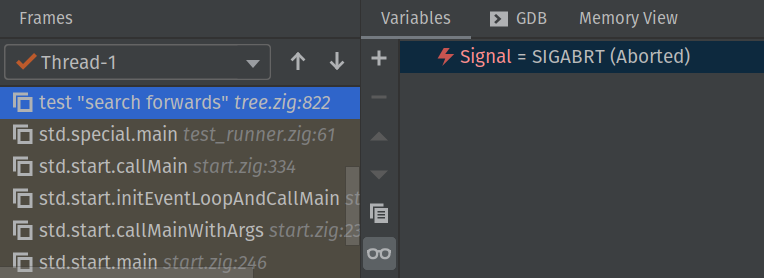
The 'toggle breakpoint' command is also greyed out.
In lieu of breakpoints, I tried pausing the debugger and using 'run to cursor'. But this ran to a different line every time I tried it, and only once to the line under the cursor.
At which point 'variables are not available'.
The 'memory view' pane is also blank.
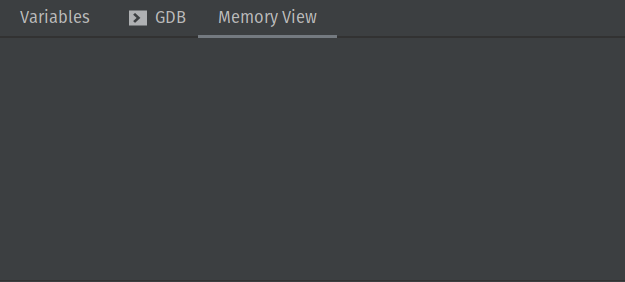
vscode + native debug extension
[nix-shell:~]$ code --version
1.51.1
e5a624b788d92b8d34d1392e4c4d9789406efe8f
x64
Fairly quick to get set up by creating a launch.json file.
{
  "version": "0.2.0",
  "configurations": [
    {
      "name": "Debug",
      "type": "gdb",
      "request": "launch",
      "target": "/home/jamie/focus/test",
      "cwd": "/home/jamie/focus",
      "valuesFormatting": "parseText"
    }
  ]
}
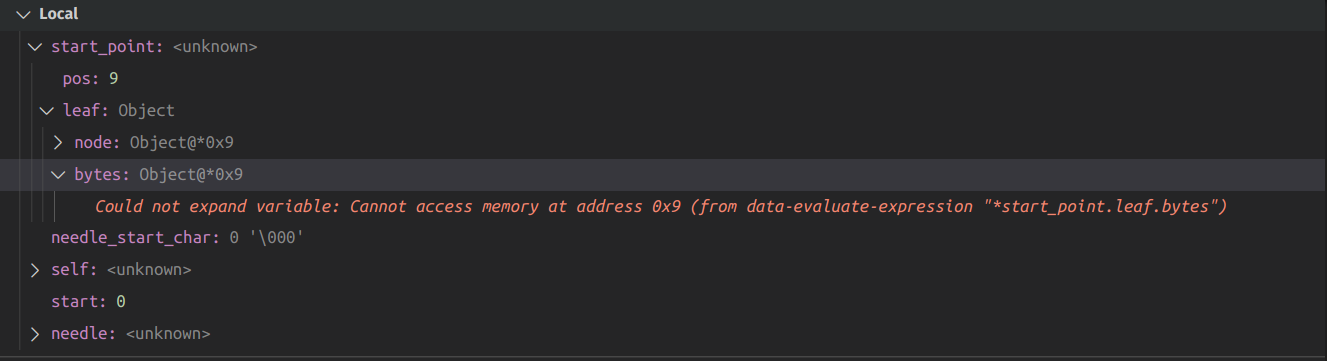
On breaking at the failed assert, vscode claims to have no local variables. But it does show their values as tooltips when I mouse over them in the editor.
When I create an actual breakpoint though the variables pane springs to life. But it's unable to print the bytes of the leaf, and also displays the wrong type for that field.
There doesn't seem to be a memory viewer.
vscode + codelldb extension
Error: spawn /home/jamie/.vscode/extensions/vadimcn.vscode-lldb-1.6.0/adapter/codelldb ENOENT
I had to patch the interpreter for that binary to get it working on nixos. Which got me as far as:
configuration: {
  name: 'Debug',
  type: 'lldb',
  request: 'launch',
  target: '/home/jamie/focus/test',
  cwd: '/home/jamie/focus',
  valuesFormatting: 'parseText',
  program: '/home/jamie/focus/test',
  relativePathBase: '/home/jamie/focus',
  __configurationTarget: 5
}
Listening on port 36863
[2020-12-13T09:03:00Z ERROR codelldb::dap_session] Send error: runInTerminal(RunInTerminalResponseBody { process_id: None, shell_process_id: Some(28670) })
thread '<unnamed>' panicked at 'called `Result::unwrap()` on an `Err` value: Utf8Error { valid_up_to: 40, error_len: Some(1) }', adapter/deps/lldb/src/strings.rs:80:38
stack backtrace:
   0:     0x7f1ada5c94e0 - <std::sys_common::backtrace::_print::DisplayBacktrace as core::fmt::Display>::fmt::hf64fbff071026df5
   1:     0x7f1ada5e9cbc - core::fmt::write::h9ddafa4860d8adff
   2:     0x7f1ada5c4837 - std::io::Write::write_fmt::h1d2ee292d2b65481
   3:     0x7f1ada5cb710 - std::panicking::default_hook::{{closure}}::h6482fae49ef9d963
   4:     0x7f1ada5cb45c - std::panicking::default_hook::he30ad7589e0970f9
   5:     0x7f1ada5cbd73 - std::panicking::rust_panic_with_hook::haa1ed36ada4ffb03
   6:     0x7f1ada5cb949 - std::panicking::begin_panic_handler::{{closure}}::h7001af1bb21aeaeb
   7:     0x7f1ada5c996c - std::sys_common::backtrace::__rust_end_short_backtrace::h39910f557f5f2367
   8:     0x7f1ada5cb909 - rust_begin_unwind
   9:     0x7f1ada5e7841 - core::panicking::panic_fmt::h4e2659771ebc78eb
  10:     0x7f1ada5e7663 - core::option::expect_none_failed::h448b58a024c2c33a
  11:     0x7f1ada5a9854 - lldb::sberror::SBError::error_string::hff20ca5f93a68bd5
  12:     0x7f1ada45e4b1 - codelldb::debug_session::DebugSession::complete_launch::h197396fdda146210
  13:     0x7f1ada3ebafb - <core::future::from_generator::GenFuture<T> as core::future::future::Future>::poll::hfa91a76b3715cfe9
  14:     0x7f1ada3e6066 - <core::future::from_generator::GenFuture<T> as core::future::future::Future>::poll::h11ce9c930539db27
  15:     0x7f1ada492b63 - tokio::runtime::task::harness::Harness<T,S>::poll::{{closure}}::hf35e784ff58ca6bb
  16:     0x7f1ada4adb88 - tokio::runtime::task::harness::Harness<T,S>::poll::hb2566aad962846f8
  17:     0x7f1ada57d439 - std::thread::local::LocalKey<T>::with::hb9f9390b9877aa03
  18:     0x7f1ada594657 - tokio::task::local::LocalSet::tick::h53cd42be3837c60f
  19:     0x7f1ada40bd21 - <tokio::task::local::RunUntil<T> as core::future::future::Future>::poll::h26dbd6d7deb98451
  20:     0x7f1ada3e82e9 - <core::future::from_generator::GenFuture<T> as core::future::future::Future>::poll::h3328d67315cd8716
  21:     0x7f1ada3d688e - tokio::runtime::enter::Enter::block_on::hbab100b0e528eaf6
  22:     0x7f1ada4aaf1b - tokio::runtime::thread_pool::ThreadPool::block_on::ha924e5bb3e54e7b5
  23:     0x7f1ada40a285 - tokio::runtime::context::enter::h88d7ee405456e527
  24:     0x7f1ada3d6a8e - tokio::runtime::Runtime::block_on::hcacefa34e5874497
  25:     0x7f1ada3fb0d4 - entry
  26:     0x5613d0714c0b - codelldb::main::h83c2fac006256d73
  27:     0x5613d0710dd3 - std::sys_common::backtrace::__rust_begin_short_backtrace::h3522e41b41d9bc74
  28:     0x5613d0710ded - std::rt::lang_start::{{closure}}::hf3e2939cf6624ebf
  29:     0x5613d080f0a1 - std::rt::lang_start_internal::h73711f37ecfcb277
  30:     0x5613d0714e88 - main
  31:     0x7f1adf037c7d - __libc_start_main
  32:     0x5613d0710499 - _start
  33:                0x0 - <unknown>
qtcreator
Fast and slick, but unable to find the source code for this executable.
others?
So far only gede approachs being usable for this simple debugging task. But it doesn't allow typing commands in the gdb console which means it likely won't work with rr.
What else should I try?